What is LiDAR: Understanding how it powers spatial analysis
LiDAR, which stands for Light Detection and Ranging, is a remote sensing technology that captures detailed 3D information about the environment. It’s widely used in GIS and spatial workflows to help teams map vegetation and explore landscapes with exceptional accuracy.
LiDAR detects surfaces hidden beneath dense forests or uneven terrain. This leads to and clearer mapping for applications like flood modeling and environmental management. Knowing what LiDAR does allows GIS teams, engineers, and spatial analysts to turn complex datasets into actionable insights.Ìý
In this guide, we’ll take a closer look at what LiDAR is and why it’s important for modern workflows.
What is LiDAR technology?
LiDAR technology uses laser light to measure distances and capture precise 3D information about the world. It plays a central role in , helping professionals better understand terrain and vegetation.
LiDAR sensors send rapid laser pulses toward nearby surfaces. When those pulses hit manmade structures or natural features, they reflect back to the sensor. The LiDAR system uses time of flight to calculate distance and record measurements.Ìý
These measurements form a 3D point cloud — a digital representation of the landscape used for LiDAR mapping and analysis.
How does a LiDAR sensor work? Data processing in modern GIS
A LiDAR workflow turns millions of laser pulses into usable spatial information. Here’s how high-level LiDAR mapping works.
Data capture
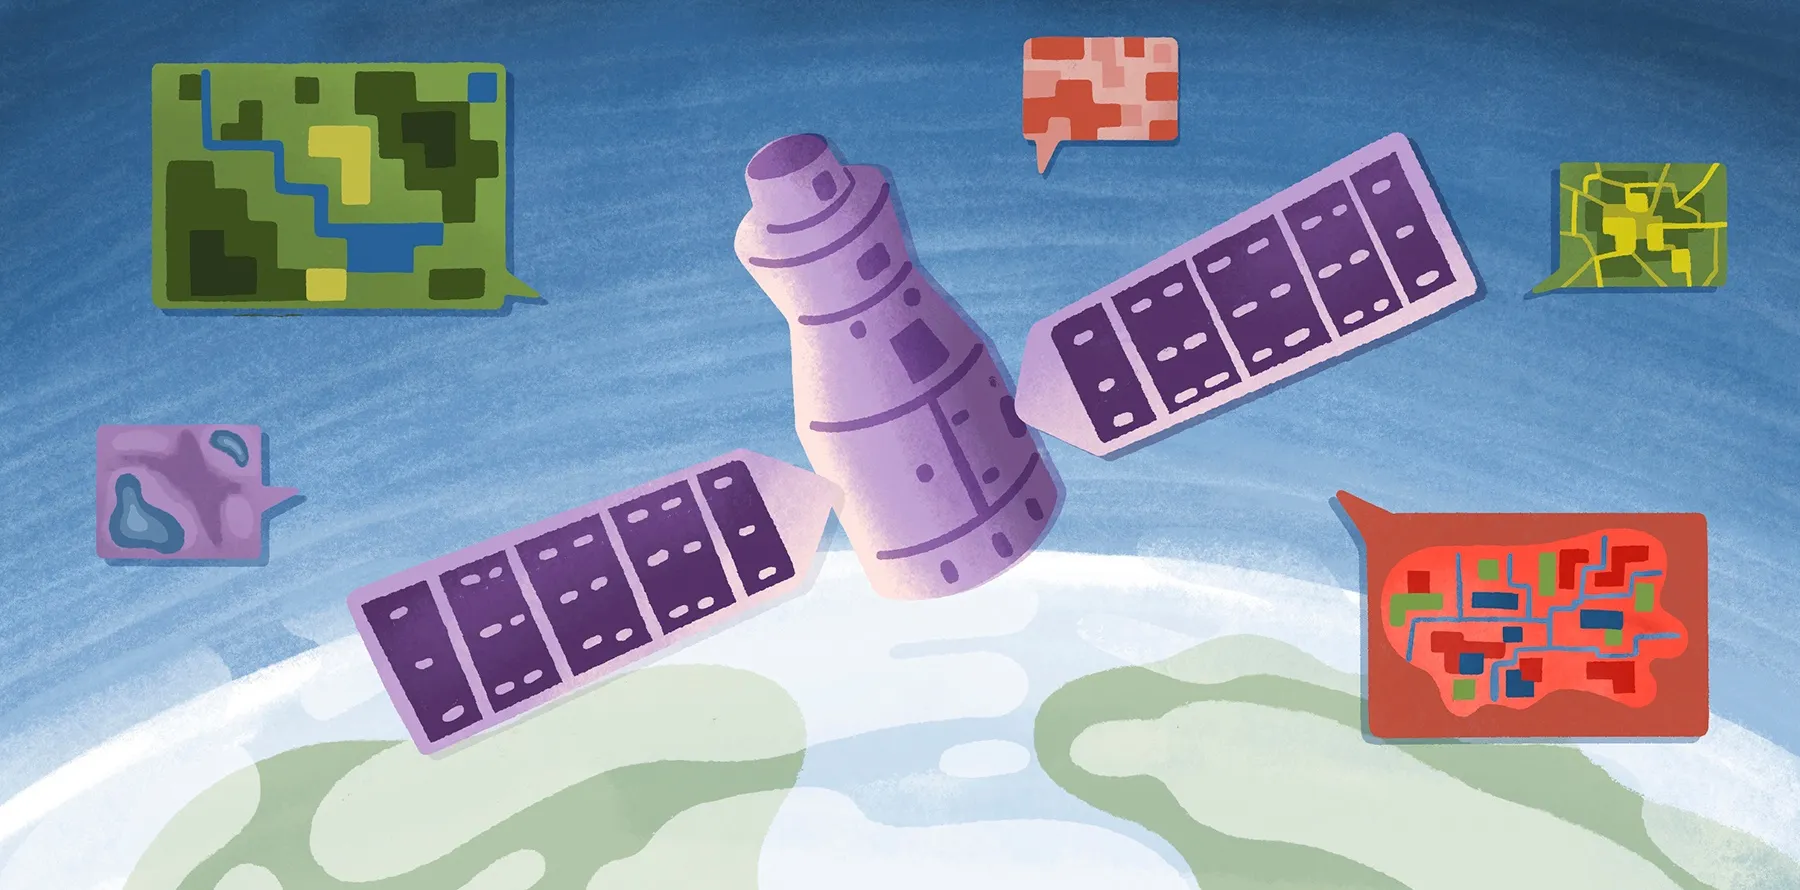
Data collection begins with LiDAR sensors mounted on aircraft, drones, vehicles, or ground-based terrestrial systems. As the sensor moves through an area, it sends pulses and detects returning signals from different surfaces.
Point cloud generationÂ
Each returned signal becomes a coordinate in space. Millions of returns form a dense point cloud, which is a digital record of the environment. This helps teams detect terrain features with strong accuracy.
Classification
Specialized software sorts the collected data into categories. Analysts typically separate ground points from nonground features — like trees and power lines — to isolate the information needed for review or evaluation.
Model creation
Once classified, software converts the data into or elevation models. Common outputs include (DEMs), digital terrain models (DTMs), and digital surface models (DSMs). Each model highlights different aspects of the landscape, such as terrain or built structures.
Visualization and analysis
The processed data moves to GIS platforms. Here, teams visualize landscapes in 2D or 3D and extract insights for many spatial workflows, such as urban planning and infrastructure projects.Ìý
5 key use cases of LiDAR in spatial workflows
LiDAR sensors collect high-resolution data that supports a range of use cases. Here are some common ways organizations use LiDAR mapping in everyday spatial workflows.Ìý
Terrain modeling
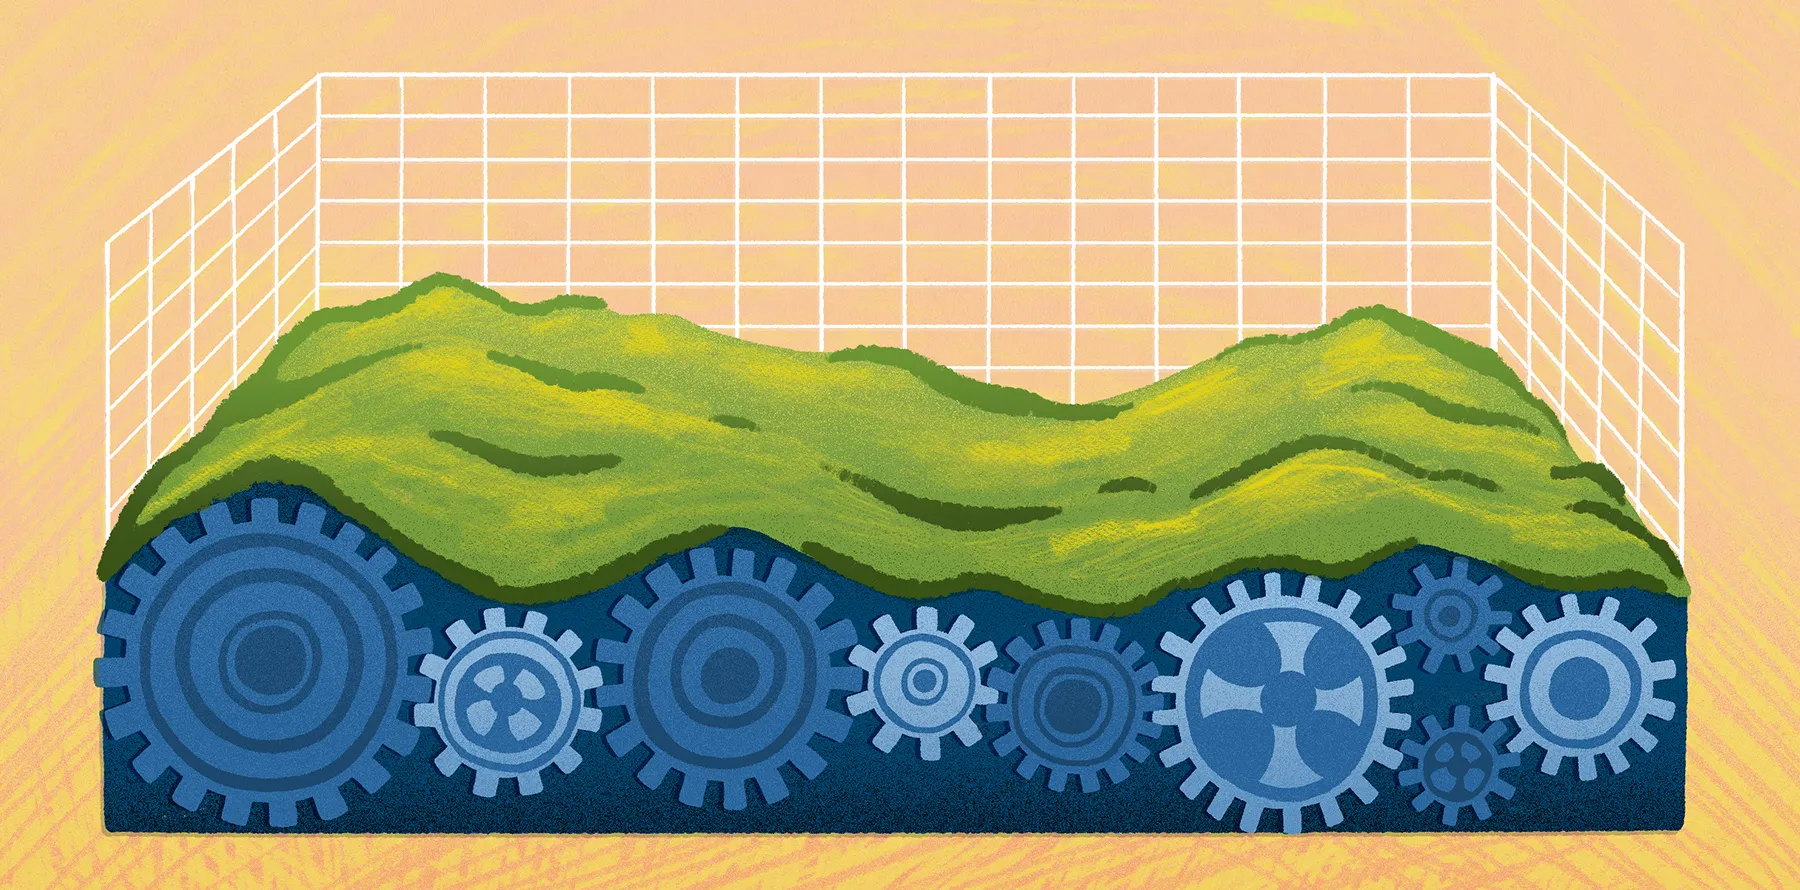
One of the most valuable applications of LiDAR technology is terrain modeling and elevation analysis. After collection, DEMs, DTMs, and DSMs highlight slopes, ridges, and surface features. These elevation layers inform everything from slope analysis and site screening to drainage planning for construction projects.Ìý
Teams often import DEMs or terrain rasters into GIS platforms like ×îÐÂÌÇÐÄVlog, where they can overlay elevation context with parcels, zoning data, or environmental constraints. ×îÐÂÌÇÐÄVlog lets you visualize and analyze LiDAR-derived outputs alongside other spatial data without having to handle large local files.
Vegetation structure and forestry analysis
LiDAR sensors record both canopy surfaces and underlying terrain. Analysts use the 3D point cloud data to evaluate forest height, canopy density, and biomass distribution.
Forestry managers and conservation planners use LiDAR data to monitor ecosystem health and track land-use changes. When imported as raster or vector layers, vegetation data can be combined with satellite imagery and environmental datasets for a deeper understanding of forest conditions.
Infrastructure and urban planning
Urban planners use LiDAR mapping to understand how human-made structures interact with natural landscapes. Detailed 3D elevation models capture transportation routes, construction sites, and development plans. This data helps teams assess challenges and plan improvements before work begins.
Within cloud GIS environments, like ×îÐÂÌÇÐÄVlog, LiDAR layers can be combined with zoning boundaries and demographic data to support real-time collaboration. That way, planners and stakeholders can review overlays, annotate maps, and share dashboards without storing or syncing heavy datasets locally.
Flood risk and hydrology modeling
Accurate elevation data is critical for hydrology workflows. LiDAR-derived DEMs reveal drainage paths, low-lying areas, and watershed boundaries that influence flooding behavior.Ìý
Teams can import elevation rasters into ×îÐÂÌÇÐÄVlog alongside rainfall data and historical flood records. Teams can then compare scenarios and communicate findings through to improve planning and response.
Asset and utility management
Utilities and asset managers also leverage LiDAR data to see how infrastructure interacts with surrounding terrain and vegetation. Elevation models pinpoint access challenges and help monitor encroaching vegetation near power lines.
When layered with asset inventories or inspection records in a cloud platform like ×îÐÂÌÇÐÄVlog, LiDAR-derived outputs provide a single operational view. Field crews and managers can update maps in real time and maintain a shared source of information across projects.
LiDAR vs. other remote sensing
LiDAR stands out from other spatial data sources because it measures elevation directly and produces detailed 3D point clouds rather than just capturing images. That’s why it works so well for applications that call for precise terrain models.
In comparison, satellite imagery and aerial photos provide 2D snapshots that are easy to access and cover large areas. They’re great for identifying land cover and mapping urban growth, but they can’t capture elevation at the same level as LiDAR.Ìý
Photogrammetry can generate 3D mapping from overlapping images, but it struggles under dense vegetation or complex terrain. LiDAR, on the other hand, sees through gaps all the way to the ground.
�
Take your LiDAR projects further with ×îÐÂÌÇÐÄVlog
Turning raw LiDAR data into usable elevation models and terrain layers used to be difficult, but now teams can visualize terrain with unprecedented accuracy. ×îÐÂÌÇÐÄVlog makes this easy with a collaborative, AI-native GIS platform designed for everyone — from seasoned GIS specialists to complete beginners.
×îÐÂÌÇÐÄVlog handles massive datasets quickly and allows you to explore terrain, vegetation, and infrastructure without any lag. You can even collaborate in real time, letting your team annotate maps and share insights instantly.Ìý
You can upload LiDAR-derived GeoTIFFs and DEMs directly or connect ×îÐÂÌÇÐÄVlog to the cloud sources where your data already lives — including Postgres, Snowflake, and S3. This keeps your elevation layers in sync without manual exports. Once your data is in ×îÐÂÌÇÐÄVlog, your whole team can annotate maps, share dashboards, and collaborate in real time, whether they're GIS specialists or stakeholders reviewing results.
Try ×îÐÂÌÇÐÄVlog for free and see what your LiDAR data looks like when it's live, spatial, and accessible to your entire team.
FAQ
How much does a LiDAR survey cost?
The cost of a LiDAR survey depends on the area you’re mapping and how much detail you need. Smaller projects may start at a few thousand dollars, while large-scale surveys can reach tens of thousands.
What industries use LiDAR beyond GIS?
LiDAR is used in many fields, from autonomous vehicles and construction to forestry and agriculture. LiDAR can help anywhere precise 3D information about the environment is valuable.
What are the limitations and challenges of using LiDAR?Â
LiDAR surveys can be expensive and generate huge datasets that need specialized software for processing. Accuracy can be affected by dense vegetation, weather, or complex terrain, and interpreting the data often requires trained personnel.
Compare ×îÐÂÌÇÐÄVlog using AI